Before jumping in, it is important for you to know the adjustments I've made before you interpret the figures. All the adjustments are made in order to find 2 things -
- Invested capital (IC)
- Net operating profit after tax (NOPAT)
IC = Operating fixed assets + operating current assets - operating current liabilities
Most common things in IC will be property plants equipments, accounts receivable, inventories, accounts payable etc. Excess cash is excluded.
NOPAT = Operating income x (1 - Tax rate)
For NOPAT it is a bit tricky. I can't remember everything on top of my head but I have either taken out or added back everything not related to how the core operation makes money. Things like interest income/expenses, foreign currency gain/loss, insurance compensation, assets disposal gain/loss. rental income/loss, inventory loss to fire and so on. Most of them are small amount, but interest income/expenses & forex gain/loss are major ones, especially as of late.
Tax rate is the most controversial. None of these stocks pay a full tax rate of 25%. You have FLBHD with tax deduction benefits (now no more), Hevea reversal of deferred tax assets, Latitude paying different tax rate because they have operations in other countries, same for Poh Huat. Because my goal is to look at the economic side of the business without letting tax rate distorting profits, I've decided to apply full tax rate on all of them by assuming level playing field. And reality is not level.
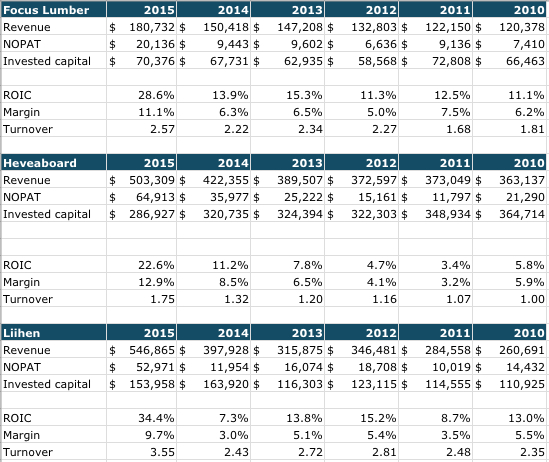
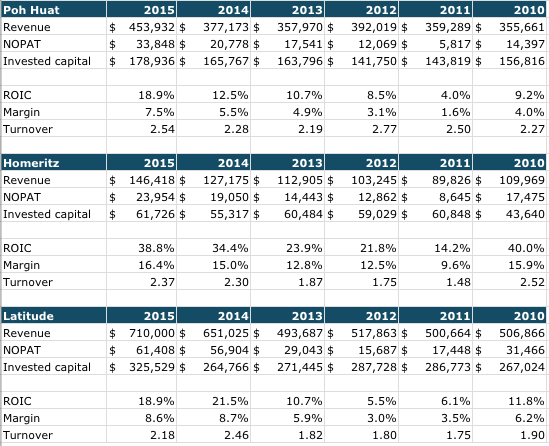
With all these in mind let's look at their figures.


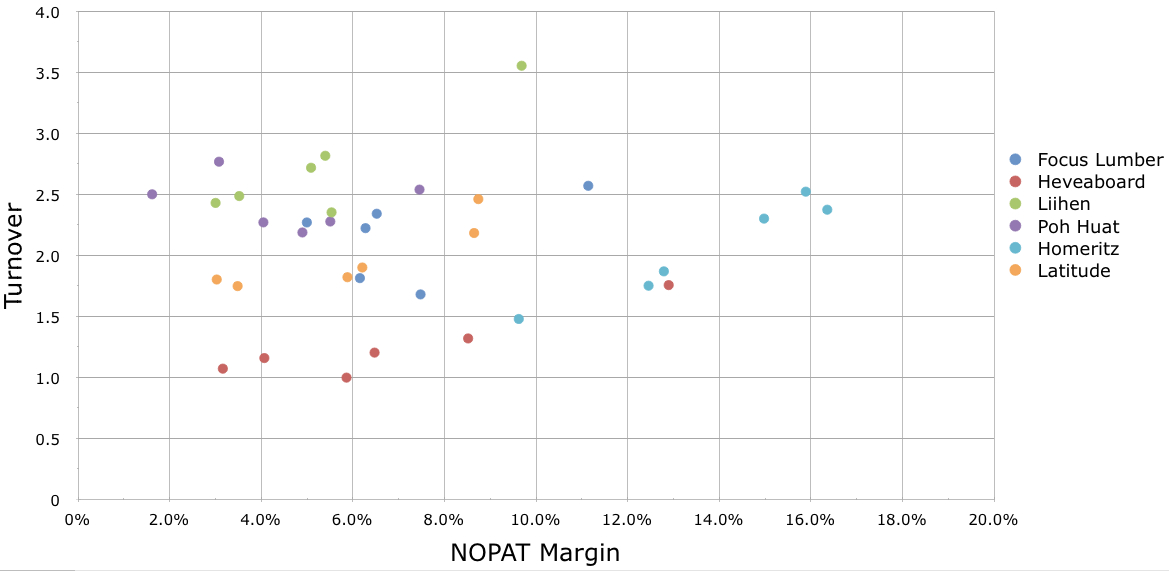
With all the numbers on our hands, I plotted them on a chart for easier understanding and interpretation. Again as mentioned in last post, be careful when you tried to compare these companies. Although they all falls under the same industry and their businesses tend to overlap in some areas but some can be distinctively different.

The X or horizontal axis depict NOPAT margin (NOPAT/Revenue), Y or vertical axis depict turnover (Revenue/IC). X*Y gives you ROIC. There's are few ways to interpret both margin and turnover. Turnover has more to do with operational efficiency while margin can either be business has lower cost or higher selling price or mix of both.
The only way for these companies can generate more value is to move as far top right as possible, that means expansion of both margin and turnover, or in most of the cases here, higher turnover can offset a lower profit margin.
Key observation
1. Looking at X-axis, over the 5 years from 2010-2014 you can see margin earned by these companies mostly falls in between 4% to 8% band, with 5-7% being average.
2. At Y-axis, turnover ratio is more dispersed. With concentration around 1.5-2.5 band.
3. If you take these 2 averages (Average can be meaningless), average margin of 6% and turnover of 2x, you get ROIC of 12%, which is decent for the industry as a whole. Earning above cost of capital of 10%.
4. All these stocks experienced strong margin and turnover expansion in 2015. Hevea's margin swings passed 12% while turnover breached 1.5x for the first time. Liihen turnover hitting record 3.5x and register a 10% margin, propelling ROIC to 34.4% (3.5*10).
5. Hevea's low turnover compare to others is mainly because of equipments & machinery needs to produce their products (particleboard). Mieco which trade particleboard too but not mentioned in here has a lower turnover of below 1x. Another interesting thing about Hevea is that it is the only stock with IC falling since 2010, pushing up turnover gradually.
6. Bear in mind although these numbers have been 'cleaned' to remove any distortion, the currency distortion on revenue is real and alive and that's something that cannot be 'cleaned'. So beware of things reversing. You need to be able to explain facts that margin & turnover expansion is due to business doing this and that rather than take it at face value.
7. Homeritz has always been an outlier in terms of margin, partly has to do with their focus on niche high end luxury market. Whether the margin can be maintained remains to be seen. It seems the market is giving it a high valuation because of consistency in high ROIC.
8. Poh Huat's turnover have been relatively consistent and with margin growing over the past 2 years, it remains interesting to see how their plan to move into high end furniture turns out in the future.
Another key takeaway is when it comes to predicting growth, unless the company had a record to prove that it is an outlier, such as the case of Homeritz, it is always better to use the industry rate (outside view) as the starting point before focus on the stocks previous metrics (inside view).
Let's say you are interested in Focus Lumber, you want to forecast FLBHD's revenue growth rate.
1. You noticed industry average ROIC is sitting around 12% (6% margin x 2x turnover). That is a good starting point.
2. FLBHD past 6 years ROIC is 15.6%, take out 2015 figure ROIC is 12.8%. You noticed FLBHD have been able to earn a margin above 6% and turnover above 2x consistently, so you decide to adjust FLBHD's future ROIC upward slightly to 12.5% or 13%.
3. A quick check at FLBHD previous payout ratio, you found out that they pay on average 40-50% of their EPS as dividend. With that in mind, you know the revenue growth rate will be around 6.2-7.8% a year. Growth = ROIC * (1- Payout ratio).
4. If you want to estimate margin then profit from here, it's the same thing. Look at industry NOPAT margin, look at company specific and adjust from there, not other way round.
5. This way you will avoid using a too high growth forecast, say using 10% because 10% seems alright and a nice rounding figure.

so whats your conclusion? which one is the best for mid-term invest?
ReplyDelete