SKP Resources Bhd was listed on Bursa Malaysia in 2000 and is categorised under the Miscellaneous Manufacturing industry. It belongs to the Industrial Product, FBM Small Cap and FBM Emas Indices. SKP Resources Bhd is an integrated plastic manufacturer, with 3 wholly owned subsidiaries: SKP (Syarikat Sin Kwang Plastic Industries Sdn Bhd), GHI (Goodhart Industries Sdn Bhd) and GHL (Goodhart Land Sdn Bhd). They also own 63% of another subsidiary known as GHT (Goodhart Technology Sdn Bhd). They are based in Batu Pahat, Johor.
Essentially, all the subsidiaries work synergistically from design and fabrication of high precision plastic molds to the manufacturing of plastic parts and components, sub-assembly and other secondary processes. Each subsidiary specialises in the manufacturing of distinct products for different clients. These parts are finally used as casings of media players, printers/scanners, video game console peripherals and also TV cabinets.
SKP Resources proudly lists their clients (both direct and indirect) from MNCs such as Apple, Fujitsu, Sharp, Pioneer, Dyson, HP, Flextronics, Microsoft and Sony.
The FY ended on 31st March 2016 and they are in their 1st quarter for FY 2017. The next quarterly results should be due sometime in August 2016. Market capitalisation stands at around RM1.4 billion.
Financial Brief and Ratios (Historical)
SKP Resources (7155.KL)
|
FY 2016
|
| Revenue (RM’000) |
1,051,027
|
| Net Earnings (RM’000) |
82,145
|
| Net Profit Margin (%) |
7.82
|
| EPS (RM) |
0.070
|
| PE Ratio (PER) |
17.52
|
| Dividend Yield (%) |
1.58
|
| ROE (%) |
23.40
|
| Cash Ratio |
0.216
|
| Current Ratio |
1.834
|
| Total Debt to Equity Ratio |
0.158
|
SKP Resources had seen stellar growth in their revenue for the past 5 years, with the highest turnover recorded in FY 2016. This translated into a profit of RM 82 million for its shareholders last year, while profit margin increased only slightly from 6.8% to 7.8% y-o-y. This is due to the increase in cost of revenue, reported at a figure of RM 902 million.
Although the PE ratio is not low, it has reduced over the years from the 40s to less than 20 today. ROE is relatively on the low end. No dividends were declared for FY2016. It is worth mentioning that the company had managed to reduce their current liabilities by nearly half from RM 410 million to RM 200 million during FY 2016.
In terms of cash flow, it has recorded its highest operating cash flow in 2015 at around RM 221 million, at the same time using up to RM 149 million for investing activities in the same year. In line with the increase in cost of revenue during FY2016, do take cautionary note that operating cash flow has turned negative to -RM 37 million from RM 221 million just a year ago. Similarly, Free Cash Flow has turned negative to -RM 70 million for FY 2016.
iVolume Spread Analysis (iVSA) & comments based on iVSAChart software – SKP Resources
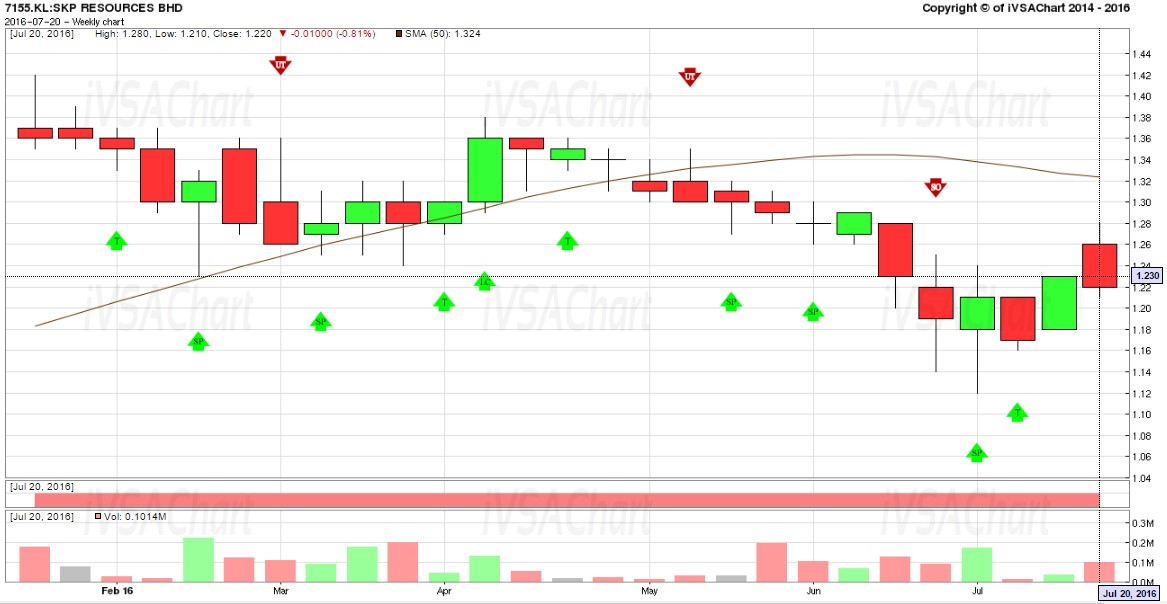
· Above is SKP Resources weekly chart showing price & volume action for the last 6 months
· Prices were ranging sideways with some Signs of Strength (green arrows) seen around pivot lows
· Although the bulls had their chance, there were unsuccessful attempts to break beyond RM 1.40 level
· Instead its’ prices drifted lower after the Sign of Weakness (red arrow) appeared in May 2016 culminating in breaking of support level around RM 1.23 in June 2016
· Strong hands emerged when prices hit around the level RM 1.14 to RM 1.12 and the down move has temporarily ceased
· For a sustainable new uptrend, not only do we need to see prices reacting favorably to the Signs of Strength (green arrow) that have appeared in July 2016 but also bullish attempts to rally and break above the RM 1.40 level
Interested to learn more?
- Join our Investment & Market Outlook Conference on 28th Aug 2016. Find out more via: https://www.ivsachart.com/investconference2016.php
- Website: https://www.ivsachart.com/events.php
- Email: sales@ivsachart.com
- WhatsApp: +6011 2125 8389/ +6018 286 9809
- Follow & Like us on Facebook: https://www.facebook.com/priceandvolumeinklse/
This article only serves as reference information and does not constitute a buy or sell call. Conduct your own research and assessment before deciding to buy or sell any stock. If you decide to buy or sell any stock, you are responsible for your own decision and associated risks.
No comments:
Post a Comment