- How Altman Z stocks work
- An updated performance chart of the Altman Z screener
- 5 stocks reviewed using the components from the Altman Z formula
I’m a boring guy so when I try to come up with ideas, I prefer to look at things that are proven.
I’ll let Mark Zuckerberg or Elon Musk change the world.
My tendency is to simply mash two good or OK ideas that work.
Since 2014, it’s been the Altman Z screener that I track and value investing.
The Altman Z formula is already proven and papers and tests prove the effectiveness if used correctly.
Same with value investing.
Value investing works and it’s been proven. I’m not saying that value investing works all the time. There are ups and downs.
See this chart below to get a real grasp of how different asset classes performed.
What does this show?
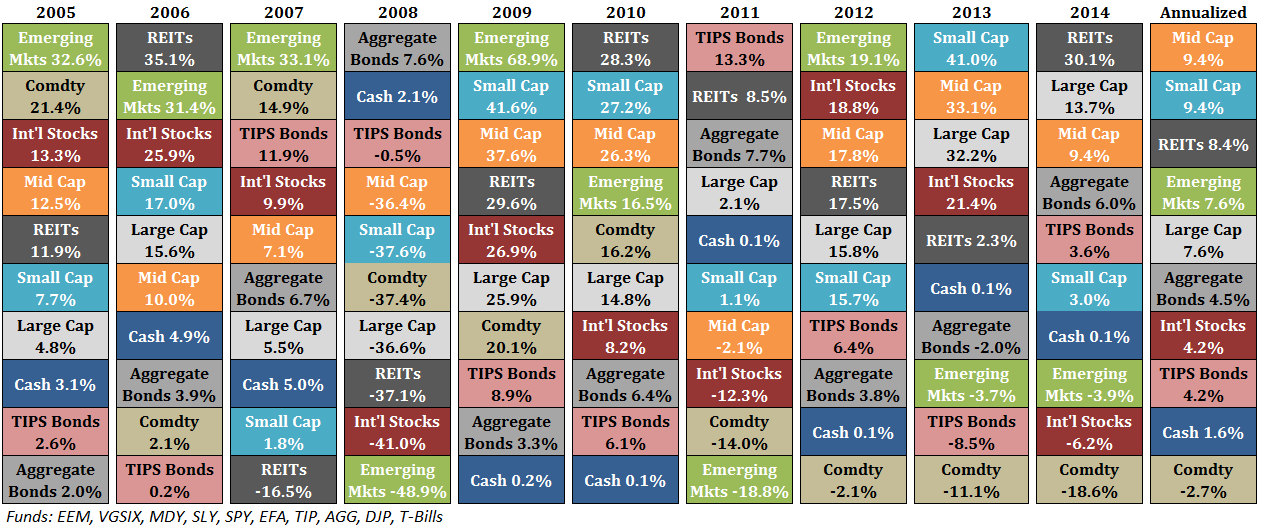
There’s more than one way to build wealth or do well in the markets.
So when you combine two good ideas, they can be great.
- French fries and ketchup
- Music and chores
- Electrons and protons
- Sleep and a comfy bed
- You get the point
Quick Recap of Altman Z
The Altman Z score is a bankruptcy check score created by NYU Professor Altman back in 1968.The score predicts whether a company will go bankrupt within 2 years. Back when the test was performed in 1968, the Altman score had an accuracy rate of 72%.
Further tests performed by Altman in 1999 and 2000 showed the accuracy to be in the 80-90% range.
It’s widely adopted by auditors but less so by investors.
The Altman Z Score
First the formula.
Z = 1.2 X1 + 1.4 X2 + 3.3 X3 + 0.6 X4 +1 X5 where
X1 = Working Capital/Total Assets
X2 = Retained Earnings/Total Assets
X3 = EBITDA/Total Assets
X4 = Market Value of Equity/Total Liabilities
X5 = Net Sales/Total Assets
Here are the rules for interpreting the Altman Z score.X1 = Working Capital/Total Assets
X2 = Retained Earnings/Total Assets
X3 = EBITDA/Total Assets
X4 = Market Value of Equity/Total Liabilities
X5 = Net Sales/Total Assets
- When Z is >= 3.0, the firm is most likely safe based on the financial data.
- When Z is 2.7 to 3.0, the company is probably safe from bankruptcy, but this is in the grey area and caution should be taken.
- When Z is 1.8 to 2.7, the company is likely to be bankrupt within 2 years.
- When Z is <= 1.8, the company is highly likely to be bankrupt.
So in a way, you’ve already been using parts of the Altman Z without knowing it.
General Points to Understand About Each Component
These are general pointers. Be sure to read the full discussion to see the pros and cons of each.X1 = Working Capital / Total Assets
The more working capital there is compared to the total assets, the better the liquidity situation.
X2 = Retained Earnings / Total Assets
The lower the ratio, the company is funding assets by borrowing instead of through retained earnings.
X3 = EBITDA / Total Assets
EBITDA / Total Assets is a variation of ROA. Instead of net income, EBIT is used for the numerator.
This ratio looks at the company’s ability to generate profits from its assets before deducting interest and taxes.
X4 = Market Value of Equity / Total Liabilities
This ratio is supposed to show you how much of the company’s market value could decline before liabilities exceed assets.
If the stock price is high, then this ratio also goes up.
X5 = Net Sales / Total Assets
Simply asset turnover.
The more money you can generate from assets, the better.
Now, Why You Should Take Notice
This performance should explain it clearly.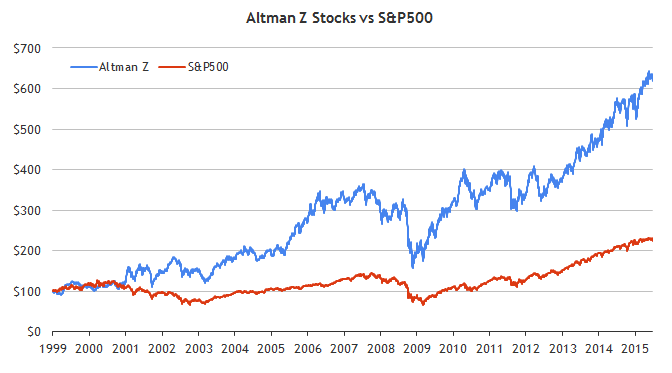
Altman Z Stocks Performance
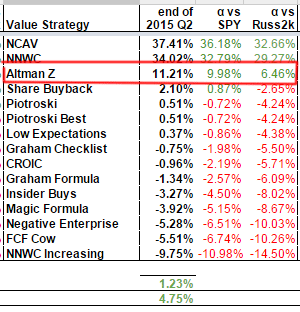
Earlier, I noted down the list of Altman Z stocks outperforming the market by just under 10%.
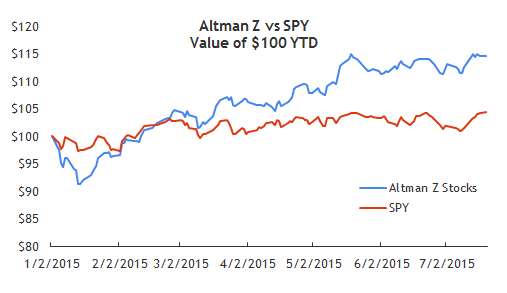
When I re-ran the results to today’s date, the performance is 14.6% despite the market volatility compared to the S&P’s total return of 4%.
So how do you use the Altman Z score to your advantage?
The common method is to use the Z score to identify potential issues with stocks.
The better way is to break down and look at each component. That way, you can choose financially sound stocks.
10 Current Altman Z Stocks to Check Out
Based on the latest Altman Z score, here are 10 stocks that are showing up on my screen with additional value-centric stats I always track.The 10 stocks are:
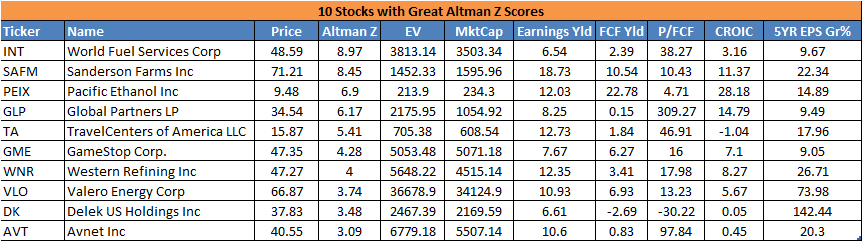
10 Altman Z Stocks
- World Fuel Services Corp. (NYSE:INT): fuel logistics, transaction management and payment processing company
- Sanderson Farms Inc. (NASDAQ:SAFM): poultry processing company
- Pacific Ethanol (NASDAQ:PEIX): ethanol based company
- Global Partners LP (NYSE:GLP): midstream logistics and marketing company for petroleum
- TravelCenters of America (NYSE:TA): operates and franchises travel centers and gasoline station/convenience store locations.
- GameStop (NYSE:GME): video game retailer
- Western Refining (NYSE:WNR): crude oil refiner
- Valero Energy Corp. (NYSE:VLO): oil refiner
- Delek US Holdings (NYSE:DK): oil refiner
- Avnet (NYSE:AVT): distributes electronic components, semiconductors, and IT solutions
Also 5 of the 10 stocks are also energy related. Not my favorite sector but when the entire sector is being trampled on, that’s the best place to start.
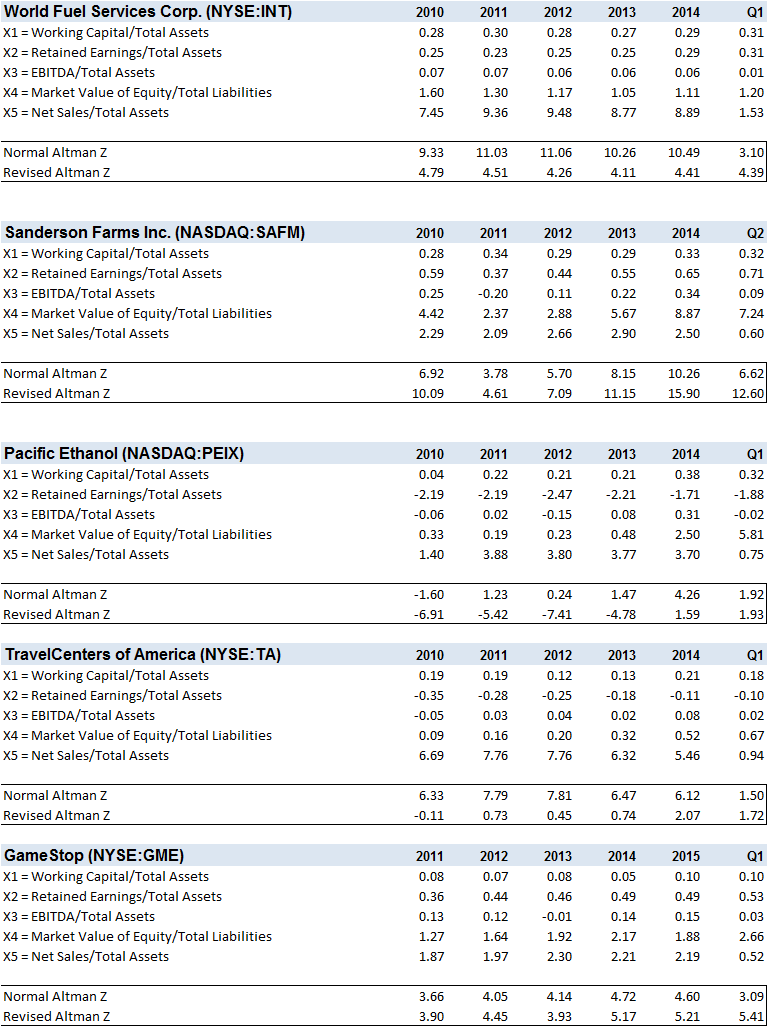
Going back to the pointers about each Altman Z component above, here’s the data for 5 of the stocks (click the image to enlarge) or download this spreadsheet with the data to see it better..
I’ve used the Old School Value analyzer here to pull in all this data automatically and cleaned up the formatting to make it easier to analyze.
But you can download the free version of the Altman Z calculator via email as part of the mini valuation course if you subscribe to this blog.
What Do I See?
From these 5 stocks and based on the generalized explanations, what do I see?X1 = Working Capital / Total Assets
I see that World Fuel Services and Sanderson Farms are the most liquid.
X2 = Retained Earnings / Total Assets
Pacific Ethanol is the worst of the bunch needing funding by borrowing. Without digging in, I can tell it has a bad balance sheet.
X3 = EBITDA / Total Assets
Sanderson Farms has the highest ratio which means that of the 5 stocks, it’s able to generate the highest profit from its assets.
X4 = Market Value of Equity / Total Liabilities
Sanderson Farms has the highest ratio which means that it’s stock price is very high or it doesn’t have much liabilities compared to its market cap.
X5 = Net Sales / Total Assets
World Fuel Services wins this one with the highest asset turnover ratio, meaning it generates more dollars from its assets.
Summary
Although I compared 5 totally different companies, can you see how useful it is when you compare competitors side by side?Instead of comparing stock prices, volume or other useless metrics side by side, try this method out.
The Altman Z score is much more versatile than a single score.
Some people may claim that it’s outdated, but you’ve seen how useful it is.
And with the way it’s been performing, it will be a shame if you ignore it.
Don’t forget to download your spreadsheet.

No comments:
Post a Comment